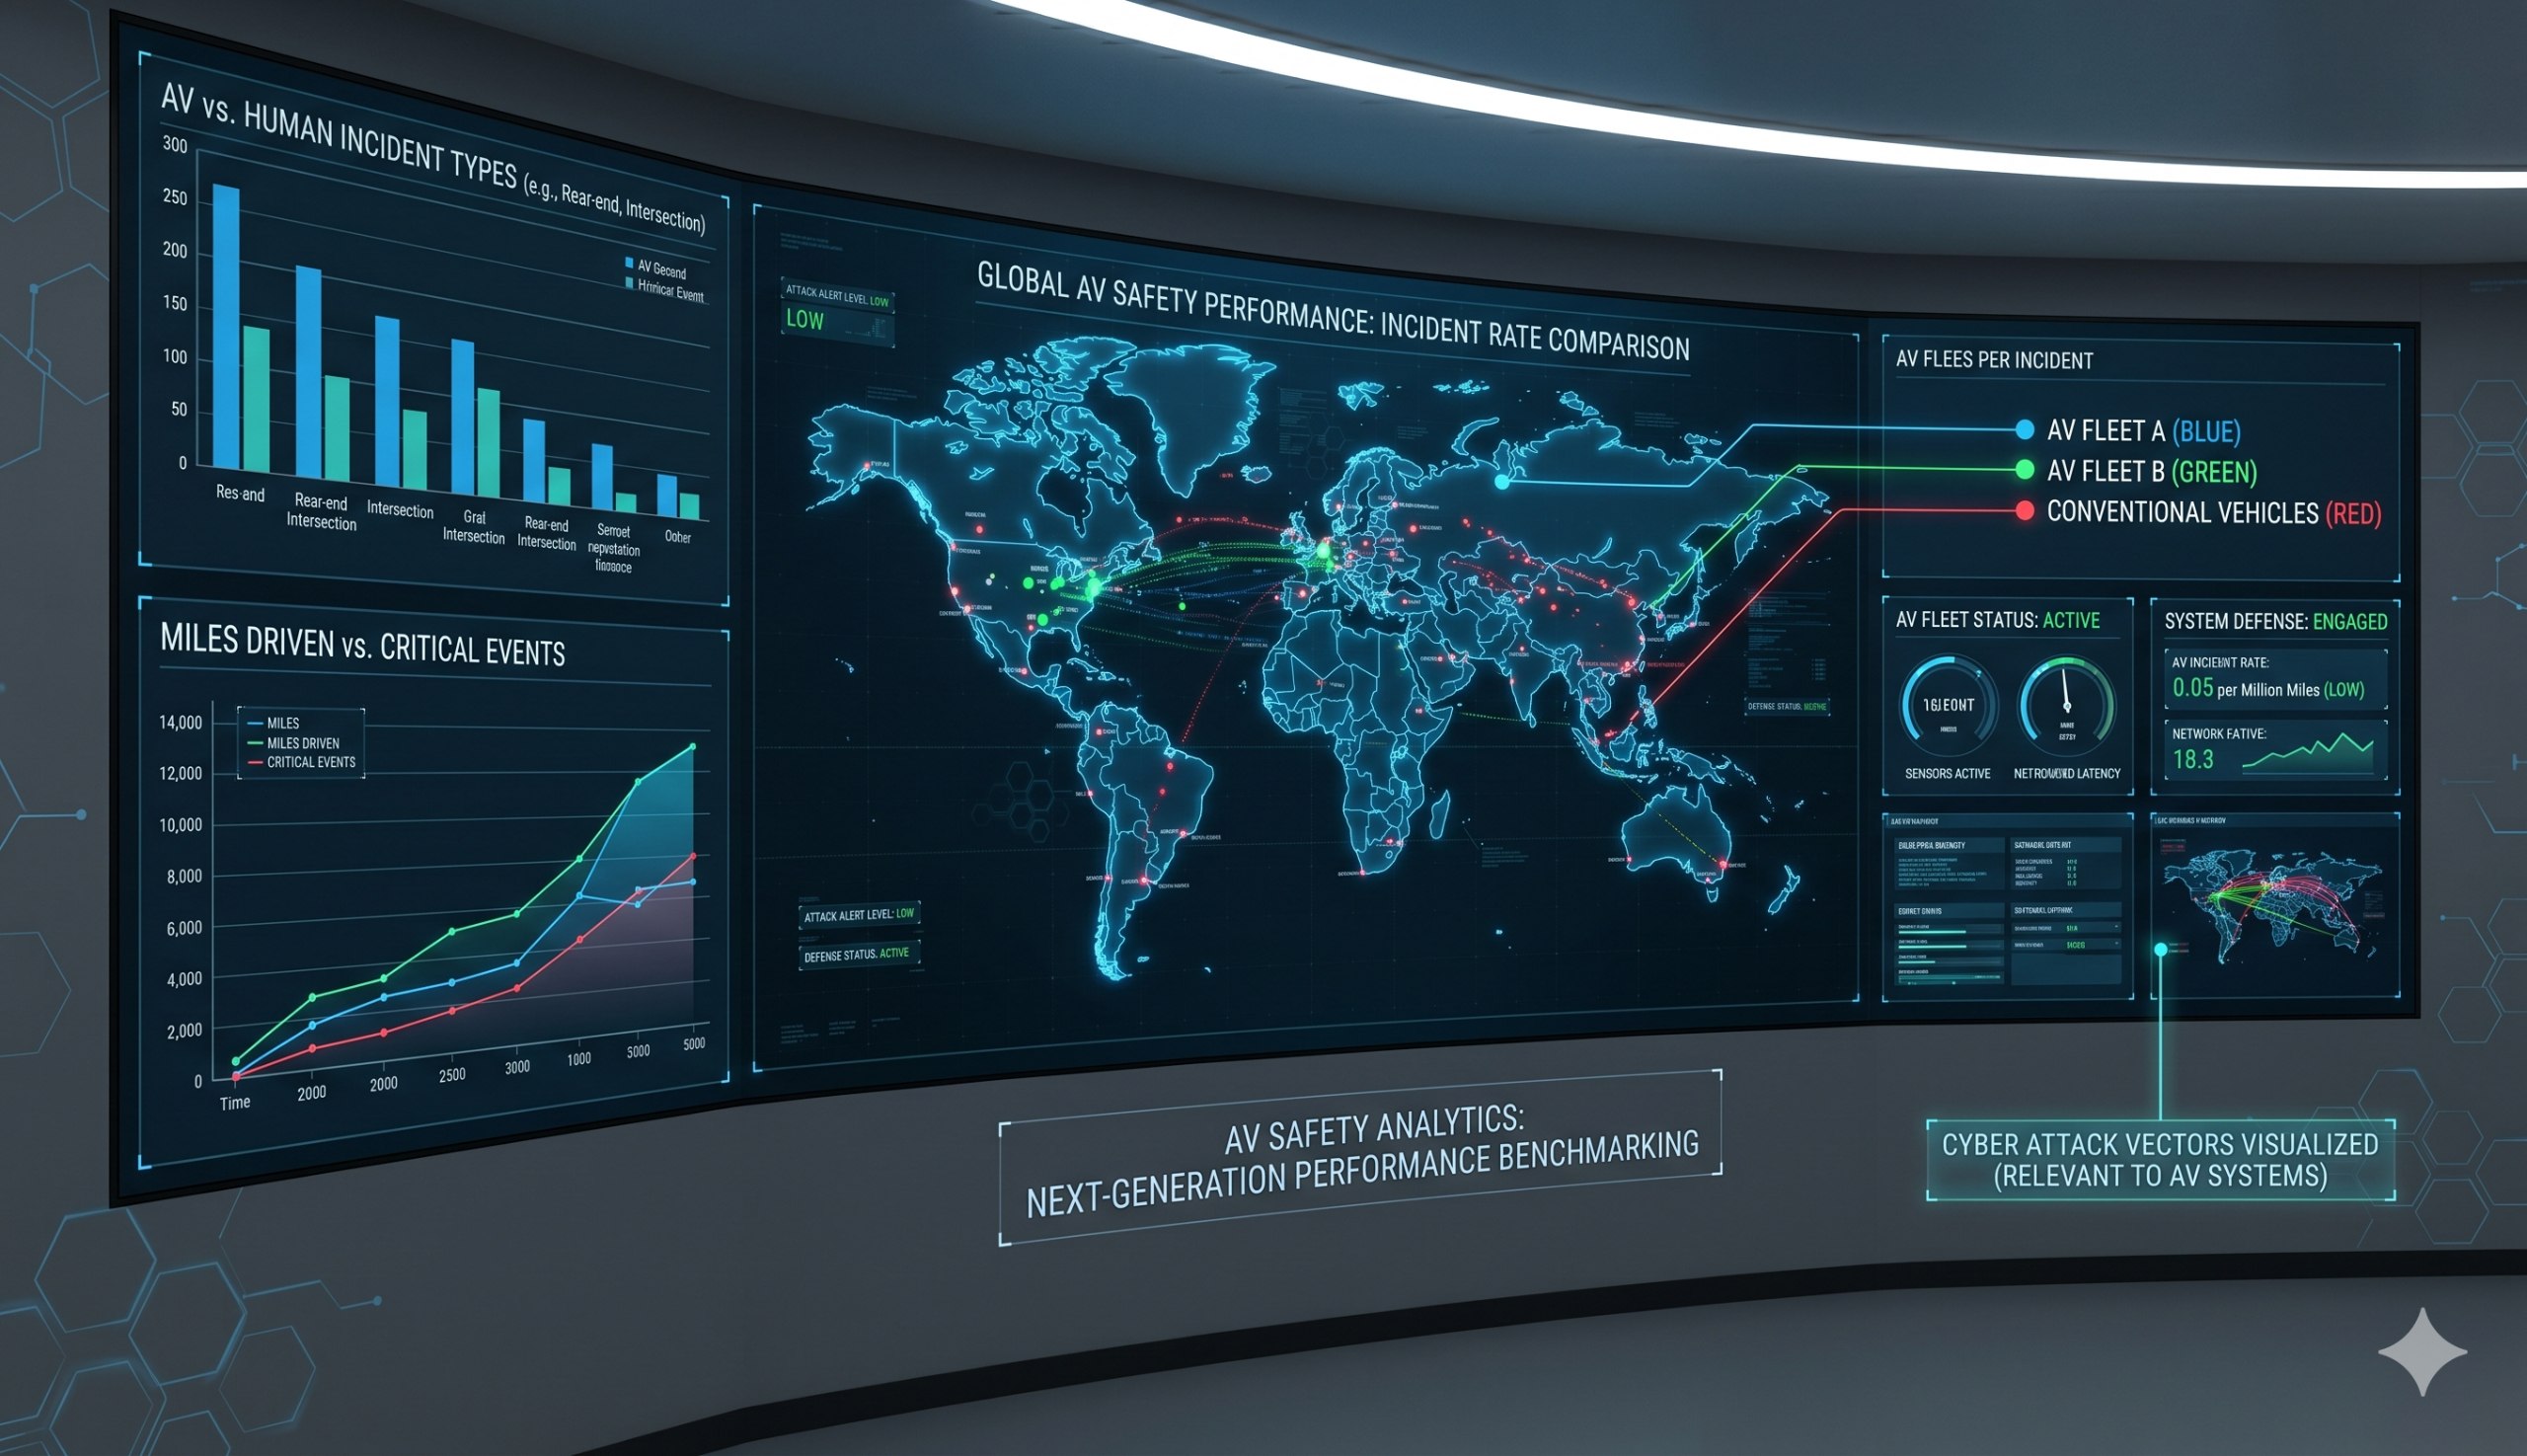
Autonomous Driving Accident Deep Analysis: The Truth Behind the Numbers
Every report of an autonomous vehicle being involved in a traffic accident sparks intense public debate. However, an objective examination of the data reveals that the safety picture of autonomous driving is far more complex than media headlines suggest. This article provides a systematic analysis of autonomous vehicle accidents based on public safety data reports from Waymo and Baidu Apollo Go.
Baseline Numbers: Autonomous vs. Human Drivers
Waymo's safety report through mid-2025 provides the most comprehensive comparative data. Across its four operating cities — Phoenix, San Francisco, Los Angeles, and Austin — over a cumulative 57.4 million miles of commercial operations (including early phases with safety drivers on some routes), the injury-involved accident rate was 0.3 per million miles. The baseline comparison is human driver performance in similar urban environments, standardized from NHTSA data, yielding a rate of 2.1 per million miles.
In other words, Waymo autonomous vehicles' injury accident rate is approximately 85% lower, representing roughly a 7x safety advantage. This is not a small-sample bias — 57.4 million miles is roughly equivalent to the aggregate of 240,000 human annual driving miles, carrying statistical significance.
Baidu Apollo Go's data points to the same conclusion. As of early 2025, Apollo Go had accumulated over 100 million kilometers of driving in Wuhan, Beijing, and elsewhere, with an accident rate of 0.19 per 10,000 kilometers, significantly lower than human drivers' 0.48 per 10,000 kilometers. Despite the vast differences in urban traffic environments between China and the US, the relative safety gains from both systems are highly consistent.
Observatory Analysis: The Story of Who Hit Whom
A frequently overlooked fact is that autonomous vehicles are in a passive position in most accidents. Waymo's report provides a detailed breakdown of all accident types:
- Rear-end collisions have the highest share (approximately 57%): Autonomous vehicles are struck from behind by human drivers while stopped normally at red lights or traveling at low speeds. This is unrelated to autonomous system decision-making and reflects the widespread problem of human driver distraction.
- Side-impact collisions (approximately 22%): Mostly occur at intersections, where human drivers ignore right-of-way rules when turning or changing lanes and collide with autonomous vehicles.
- Accidents caused by the autonomous vehicle (approximately 12%): This is the most noteworthy category. The most common trigger scenarios include decision-making delays in complex roundabouts, inappropriate reactions to unusual vehicle behavior (such as cyclists riding against traffic), and reduced perception confidence in special weather conditions (heavy rain, dense fog).
Notably, Waymo proactively disclosed a phenomenon termed "Phantom Obstacles": in certain situations, the autonomous driving system may "see" non-existent obstacles due to sensor noise or algorithm errors, causing unnecessary hard braking. While this conservative behavior does not directly cause accidents, it may induce rear-end collisions from following vehicles.
Sources of Public Perception Bias
Why does the public generally overestimate the safety risks of autonomous driving? We identify three key factors:
First is selection bias in media coverage. The volume of media reporting on autonomous vehicle accidents is completely disproportionate to human traffic accidents. A minor scratch incident involving an autonomous vehicle receives far more attention than hundreds of fatal human crashes occurring in the same period. This systematically amplifies public perception of autonomous driving risks.
Second is asymmetric responsibility attribution. When human drivers make errors, society attributes them to individual behavior. But when autonomous vehicles make errors, the public attributes them to the system or technology itself, questioning the safety of the entire industry. This asymmetry places disproportionate pressure on regulators and companies.
Third is excessively high expectations for technological reliability. People subconsciously set the standard as "zero accidents." But this has never been achieved in the human driving world — approximately 1.35 million people die annually from road traffic accidents worldwide, an average of 3,700 per day. Setting the standard for autonomous driving as "a good driver better than humans," rather than "flawless," is the rational evaluation framework.
Outlook
Looking ahead to 2026-2028, autonomous driving safety data will show two trends:
First is increased data transparency. Waymo's annual safety report model is becoming an industry standard — GM's Cruise, Amazon's Zoox, and Baidu's Apollo have all begun publishing structured safety data. This transparency not only helps alleviate public concerns but, more importantly, pushes the entire industry from "reactively responding to accidents" toward "proactively preventing risks."
Second is the establishment of edge-case data-sharing mechanisms. Currently, every autonomous driving company is independently facing the "Long Tail Problem" — those extremely low-probability but high-risk scenarios. We expect the industry will gradually establish some form of scenario data-sharing consortium, similar to aviation's Accident Reporting System (ASRS), allowing developers to share edge-case response strategies without revealing trade secrets.
Safety should not be a competitive advantage — it should be an industry access condition. The true social value of autonomous driving lies not in the technology itself, but in whether it can be safer than the current road system. The answer to this question, the data is already sending a very positive signal.